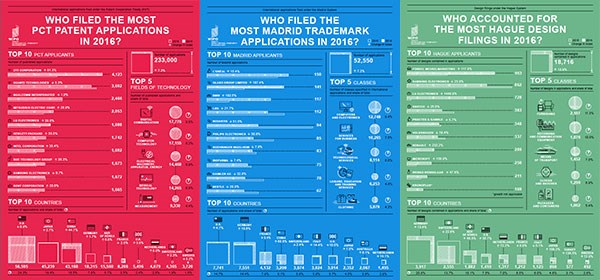
China’s ZTE Corporation overtook its crosstown rival Huawei Technologies as the biggest filer of international patent applications via WIPO in 2016 and U.S.-based Qualcomm Inc. claimed third position amid another year of strong demand for WIPO’s intellectual property filing services for patents, trademarks and industrial designs.
Overall, applicants based in the United States maintained their number one ranking for the 39th year running, accounting for roughly a quarter (24.3%) of the 233,000 applications filed under WIPO’s Patent Cooperation Treaty (PCT) in 2016 – itself a 7.3 percent year-on-year increase – followed by applicants in Japan (19.4%) and China (18.5%), with the latter driving the overall growth in demand. Digital communications and computer technology showed the greatest activity by sector.
Similar to the PCT, demand grew by 7.2 percent for WIPO’s international trademark filing service (Madrid System), which saw 52,550 applications, while the number of industrial designs handled by WIPO’s Hague System rose 13.9 percent to 18,716 – it is the seventh year in a row of growth in all three WIPO filing systems, which save filers time and money.
“In an interlinked, knowledge-based global economy, creators and innovators are increasingly relying on intellectual property to promote and protect their competitive edge around the world,” said WIPO Director General Francis Gurry. “China-based filers are behind much of the growth in international patent and trademark filings, making great strides in internationalizing their businesses as the country continues its journey from ‘Made in China’ to ‘Created in China’.”
Patents
In 2016, U.S.-based applicants filed 56,595 PCT applications, followed by applicants from Japan (45,239) and China (43,168), which has posted double-digit growth each year since 2002. If this current trend continues, China will overtake the U.S. within two years as the largest user of the PCT System. Germany and the Republic of Korea with 18,315 and 15,560 applications were ranked fourth and fifth, respectively (Annex 1 PDF, Annex 1: PCT international applications by origin). China and India (1,529) are the only two middle-income countries among the top 15 origins.
In total, Asia accounted for 47.4% of total PCT applications, just short of the combined share of Europe (25.6%) and North America (25.3%).
Among the top 15 origins, China recorded extraordinary growth (+44.7%), while Italy (+9.3%), Israel (+9.1%), India (+8.3%) and the Netherlands (+8%) also saw strong growth rates. In contrast, Canada (-17.3%) – for the second consecutive year – saw a substantial decline in filings, linked to declining applications from RIM/Blackberry and Nortel.
Shenzhen -based telecoms companies – ZTE Corporation (4,123 published PCT applications) and Huawei Technologies (3,692) – occupied the top two spots in the list of top PCT applicants, with ZTE moving up two spots to push Huawei out of the leader position. They were followed by Qualcomm Incorporated of the U.S. (2,466), Mitsubishi Electric Corporation of Japan (2,053) and LG Electronics of the Republic of Korea (1,888). The top 10 applicant list comprised seven companies from Asia and three from the U.S. (Annex 2 PDF, Annex 2: Top PCT applicants).
Among educational institutions, the University of California – with 434 published PCT applications – was the largest user of the PCT System and has maintained that position since 1993. Massachusetts Institute of Technology (236) was ranked second followed by Harvard University (162), Johns Hopkins University (158) and the University of Texas System (152) (Annex 3 PDF, Annex 3: Top PCT applicants by educational institution). While the top 10 is dominated by U.S.-based institutions, top 20 list consists of 10 U.S. and 10 Asian universities.
Digital communication (8.5%) accounted for the largest share of published PCT applications, followed by computer technology (8.2%), electrical machinery (6.9%) and medical technology (6.8%) (Annex 4 PDF, Annex 4: PCT international applications by field of technology). Among the top 10 technologies, medical technology (+12.8%) optics (+12.7%) and digital communication (+10.7%) saw the fastest growth in 2016.
Trademarks
U.S. applicants (7,741) filed the largest number of international trademark applications using WIPO’s Madrid System for the International Registration of Marks in 2016, closely followed by Germany (7,551), France (4,132), China (3,200) and Switzerland (3,074). China, Turkey (1,221; ranked 12th) and the Russian Federation (1,176; 13th) are the only three middle-income countries in the top 15 list (Annex 5 PDF, Annex 5: Madrid international applications by origin and designated members).
Among the top 15 origins, China saw the fastest growth (+68.6%) in 2016, followed by the Russian Federation (+32.7%), Italy (+14.4%) and the Netherlands (+14.1%). Austria (-3.8%), France (-0.4%), the Republic of Korea (-0.5%) and Switzerland (-2.4%) saw filing declines.
L’Oréal of France with 150 applications headed the list of top filers, followed by Glaxo Group of the U.K. (141), Germany’s BMW (117) and Lidl (112). Swiss company Novartis, which was ranked in first position in 2015, filed 100 fewer applications in 2016 and with its 94 applications now ranks in fifth position (Annex 6 PDF, Annex 6: Top Madrid applicants).
Computers and electronics was the most specified class in international applications accounting for 9.4% of the total, followed by services for business (7.6%) and technological services (6%). Among the top 10 classes, technological services (+11.3%), and computers and electronics (+10.6%) saw the fastest growth.
China (with 22,314 designations), the European Union (21,526) and the U.S. (20,979) were the three most designated members in international Madrid applications. Middle-income countries such as the Russian Federation (14,604), India (11,105), Mexico (9,098) and Turkey (8,679) also received substantial numbers of designations in 2016. China has been the top designated country since 2006.
Industrial designs
International industrial design applications filed via WIPO’s Hague System for the International Registration of Industrial Designs grew by 35.3% in 2016. While designs contained in those applications grew by 13.9%. The 5,562 applications filed in 2016 contained 18,716 designs (Annex 7 PDF, Annex 7: Hague international applications by origin and designated members).
Germany with 3,917 designs was the largest user of the Hague System, followed by Switzerland (2,555), the Republic of Korea (1,882), the U.S. (1,410) and the Netherlands (1,317). Among the top 10 origins, Japan (+109.2%) and Turkey (136.5%) each saw substantial growth in 2016, albeit from a low base.
Fonkel Meubelmarketing of the Netherlands (953 designs) overtook Samsung Electronics of the Republic of Korea (862) as the largest user of the Hague System. The Republic of Korea’s LG Electronics with 728 designs was in third position, followed by Swatch of Switzerland (383) and Procter & Gamble of the U.S. (348) (Annex 8 PDF, Annex 8: Top Hague applicants).
Furnishing accounted for the largest share of total designs (11.3%), followed by recording and communication equipment (10%), means of transport (7.8%) and clocks and watches (6.9%).
The European Union with 14,952 designs was the most designated Hague member in applications. It was followed by Switzerland (8,811), Turkey (6,137), the U.S. (4,722) and Norway (3,324).
Source: http://english.vipri.gov.vn/tin-tuc/hoat-dong-shtt-quoc-te/record-year-for-international-patent-applications-in-2016-strong-demand-also-for-trademark-and-industrial-design-protection-41731.html


